VS Code online and networked
2018-01-25 — 2025-01-25
Wherein Remote Usage of VS Code Is Treated, and a Procedure for Attaching a Python Debugger via Debugpy on a Forwarded Port Is Outlined, With SSH Tunnels and Tmux Persistence Being Noted.

Here are tips for using VS Code as a collaborative cloud-friendly editor, in several senses.
1 “Remote”
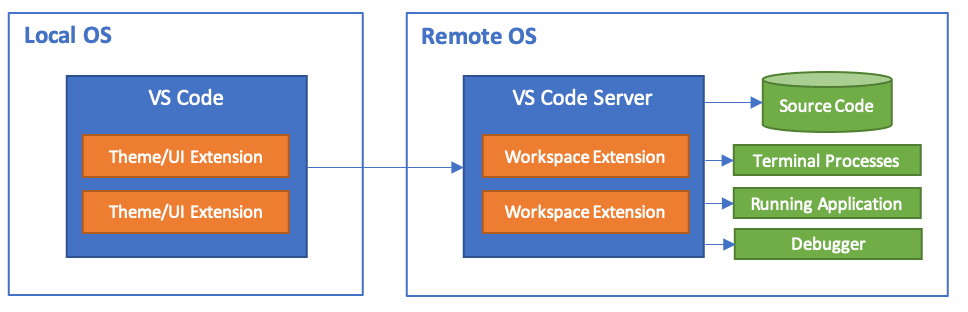
Remote edits code over a network channel to a remote machine from a local VS Code desktop window Figure 2. The remote execution environments can be elsewhere on the internet, or they can be local VMs, which is why I have “scare quotes” around the word “remote”. VS Code makes this seamless by installing some helper executables on the remote side that interact smoothly with the local side. Occasionally, some extensions do not work gracefully across the barrier between local and remote, but for most of my workflows, the problem does not arise. VS Code remote is generally (although not strictly) feature-superior to remote jupyter usage.
Use in practice is best explained by using the tutorial examples.
| Tutorial | Description |
|---|---|
| Remote via SSH | Connect to remote and virtual machines with Visual Studio Code via SSH. |
| Work in WSL | Run Visual Studio Code in Windows Subsystem for Linux. |
| Develop in Containers | Run Visual Studio Code in a Docker Container. |
| GitHub Codespaces | Connect to a codespace with Visual Studio Code. |
Also, I wrote about getting remote debugging for Python working in a fiddly environment, see below.
Pro tip: remote editing via an unreliable or intermittent network connection can be a drag over SSH. There is no universal persistent SSH session solution at time of writing. It would be nice if it worked over eternal terminal but it does not. However, Christopher LaPointe’s solution using tmux provides a bandaid; and the Microsoft Dev Tunnel is anecdotally more robust over unreliable connections.
tl;dr:
{
  "terminal.integrated.profiles.linux": {
    "tmux": {
      "path": "/usr/bin/tmux",
      "args": [
        "new-session",
        "-A",
        "-s",
        "vscode-${workspaceFolderBasename}"
      ]
    }
  },
  "terminal.integrated.defaultProfile.linux": "tmux",
  "remote.SSH.defaultForwardedPorts": [
    {
      "localPort": 9002,
      "remotePort": 9002,
      "name": "SA"
    }
  ]
}Jupyter Notebook can interact badly with VS code remote, losing data if a buggy extension is installed. (See also.)
Me too. It seems to be something to do with stale lock files:
VS Code installs a lot of crap in your home folder on the remote machine— a new copy of VS Code for every minor version update, for example. I’m pretty sure the ones that end in .bak or .locked are pointless.
I also wrote a script that deletes all but the latest copies of VS Code on the remote server. (Use at your own risk.)
I operate my connections to remote servers over an unreliable, Australian-quality internet connection, over an unreliable corporate VPN, so my connections to remote servers are often dropped.
Minimise the pain of dropped connections by using tmux to keep your session alive, spawning from the console. Quit and restart VS Code as needed, but your tmux session will persist, and it will automagically reconstruct the SSH tunnel forwarding to maintain access to the remote server.
1.1 Dev tunnels
Microsoft’s Dev Tunnels do not appear to be an SSH tool but behave similarly, claiming to be more persistent over unreliable connections. They appear to be supported by VS Code as a means of remote access.
Microsoft dev tunnels background:
For an example of use with VS Code, see the VS Code + Tunnels docs and, e.g. Port forwarding local services with VS Code.
2 VS Code server
I have not tested this configuration recently.
Run a server process that makes VS Code accessible to you in a browser. No local copy of VS Code is required; you use a browser window for everything.
I have not had a need for VS Code Server mode yet, because any scenario where I have HTTPS browser access to a remote server, I have also had SSH access and so it has been easier to use the VS Code Remote setup.
However, a completely browser-based IDE might be useful in some circumstances: in exotic devops scenarios, through painful firewalls, when working from a thin client, something like that?
There are several supported configurations.
Mainline VS Code server:
There are also two community-maintained forks:
- Code-server by Coder: The Developer Workspace Platform seems actively maintained and popular. AFAICT it is Linux-only.
- gitpod-io/openvscode-server
I do not know the difference between the affordances of all these options.
3 Google Cloud
We can use VS Code as a remote APU for google cloud, apparently. Maybe. GoogleCloudPlatform/cloud-code-vscode: Cloud Code for Visual Studio Code: Issues, Documentation and more
Cloud Code for VS Code brings the power and convenience of IDEs to cloud-native Kubernetes and Cloud Run application development. Cloud Code works with Google’s command-line container tools like
skaffoldandkubectlunder the hood, providing local, continuous feedback on your project as you build, edit, and run your applications locally or in the cloud.
4 Google Colab
Distinct, both in billing and API, from generic google cloud, but also possible?
6 Remote python debugger
Having said that everything is seamless, there are in fact edge cases where the divide between what is here on the client and what is there on the remote server becomes important. One of those cases is interactive debugging.
Here is a worked example of what I needed to do to get a remote python debugger working from my local machine. Finding out why code that works locally does not work in the actual target deploy environment.
First, install the debugpy package in our project. How to install depends on how we are managing your python environment, but it will probably be one of these:
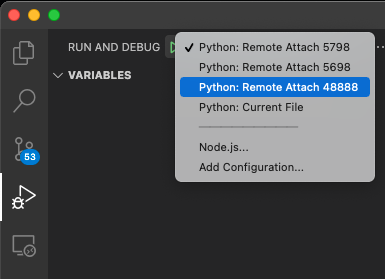
Now I choose a network port for the debugger.1 This port needs to be unique to me (in the sense that no one else on the remote machine should be using it) and it should be between 1024 and 65535. For simplicity’s sake I will assume the port is 48888, but I would recommend against that number for you because someone else might have copy-pasted these instructions and got there first, if you are using a shared machine. (Although not me; I use different port numbers in reality, this is just a tutorial example).
Next, Figure 3 we do a one-time setup of VS Code to know that it should look for that port by finding the debug tab in VS Code and adding a configuration.
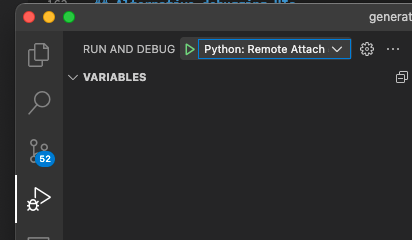
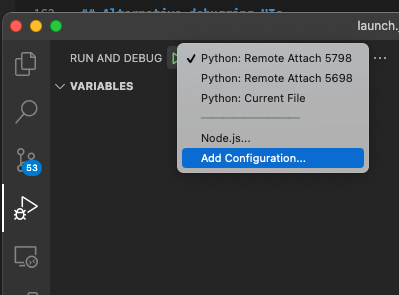
This will open launch.json into which we can add a configuration for a remote attach debugger:
This part is clunky, but after one-time setup everything goes smoothly. VS Code will do all the remaining necessary networking by magic.
OK! Almost there. We still need to load up our code on the server to use the debugpy module. Two options here.
Firstly, we could invoke the code from the VS Code terminal like this:
Alternatively, we could load and execute the debugging system inside myscript.py:
Either way, VS Code will detect what I am doing and magically open up an SSH tunnel from here to there. Now, if you did the wait_for_client thing, the code will pause and wait for a debugger connection.
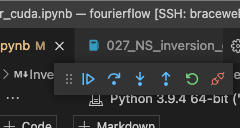
OK great, so now I select that debug configuration I created earlier in order to get my debugger to connect
I was stuck for ages on this, but now I ALSO NEED TO CLICK THE GREEN TRIANGLE or it doesn’t start. And then… That’s it. We are done.
The debugger will show what is happening in general, but it is especially useful when
- we hit a line that raises an exception, or
- the code hits the line
breakpoint()which will cause the debugger to drop into the code right there.
How does the debugger work? I do not need to explain because Microsoft has already done that. But tl;dr there is now a lot of information about my running code, a graph of the current call stack, a little tab to inspect the current value of variables, etc.
7 Firewall rules we need
Pro tip. For use behind a firewall, AFAICT VS Code requires the following whitelist exceptions:
*.online.visualstudio.com*.liveshare.vsengsaas.visualstudio.com:443
For GitHub Copilot:
vscode-auth.github.comapi.github.comcopilot-proxy.githubusercontent.com
A list of miscellaneous URLs that VS Code likes includes:
update.code.visualstudio.com— Visual Studio Code download and update servercode.visualstudio.com— Visual Studio Code documentationgo.microsoft.com— Microsoft link forwarding servicevscode.blob.core.windows.net— Visual Studio Code blob storage, used for remote servermarketplace.visualstudio.com— Visual Studio Marketplace*.gallery.vsassets.io— Visual Studio Marketplace*.gallerycdn.vsassets.io— Visual Studio Marketplacerink.hockeyapp.net— Crash reporting servicebingsettingssearch.trafficmanager.net— In-product settings searchvscode.search.windows.net— In-product settings searchraw.githubusercontent.com— GitHub repository raw file accessvsmarketplacebadges.dev— Visual Studio Marketplace badge serviceaz764295.vo.msecnd.net— Visual Studio Code download CDNdownload.visualstudio.microsoft.com— Visual Studio download server, provides dependencies for some VS Code extensions (C++, C#)vscode-sync.trafficmanager.net— Visual Studio Code Settings Sync servicevscode-sync-insiders.trafficmanager.net— Visual Studio Code Settings Sync service (Insiders)vscode.dev— Used when logging in with GitHub or Microsoft for an extension or Settings Syncdefault.exp-tas.com— Visual Studio Code Experiment Service, used to provide experimental user experiences
In addition, it will be easier to install extensions with the following exceptions:
marketplace.visualstudio.comvscode.blob.core.windows.net*.vo.msecnd.net*.gallerycdn.vsassets.iodownload.microsoft.com(only some extensions)download.visualstudio.microsoft.com(only some extensions)
Footnotes
Technically we need to choose a port on the local AND remote machine, and these can be different, but why do that?↩︎