Spatial data in R
2021-03-21 — 2023-06-13
Wherein R Is Employed as a Geographic Information System, and the Modern Simple‑features Sf Workflow With GeoJSON Export Is Described for Producing Maps, Tiles, and Interactive Web Integration.
On using R as a geographic information system.
I am indebted to Ross Darnell and Petra Kuhnert for invaluable tips that got my understanding started.
1 Theory of spatial statistics
Not R-specific? See spatial statistics or spatiotemporal statistics.
2 How to
Robin Lovelace, Jakub Nowosad and Jannes Muenchow’s free textbook, Geocomputation with R, seems to be the most up-to-date resource. Slightly more recently updated but with less promotion, Edzer Pebesma and Roger Bivand’s Spatial Data Science seems like it might be good. Manuel Gimond’s lecture notes are good: Intro to GIS and Spatial Analysis.
3 Geographical encodings

For theory, see spatial statistics. Technical details go here.
There are some standards to be aware of when it comes to encoding geographical coordinates. The classic R format for spatial data information is sp, which is some kind of convention for encoding spatial data in something similar to, but not totally like, a dataframe. Much spatial code in R uses sp-style access, notably the rgdal, rgeos and maptools packages. All such packages are discontinued.
More recently, sf has become the hotness. This ecosystem includes several parts. Firstly, there is a standard (Simple features / simple feature access) which is nothing to do with R. This has a formal ISO standard number and reams of documentation about how computers can handle the spatial geometry and informatics. This standard now underlies ESRI ArcGIS, GDAL and the GeoJSON standard.
sf is also an R package which plugs various technology into all those systems via the sf standard and aims at superseding sp in the long term. Its data storage seems to be more dataframe-like.
See also terra, which is somehow related.
Conversion from legacy code is apparently simple according to the sf manual
as_Spatial()allows to convertsfandsfctoSpatial*DataFrameandSpatial*forspcompatibility. You can also useas(x, "Spatial")To transformspobjects tosfandsfcwithas(x, "sf").
Did you follow that? Pitfalls of working with each of them are summarised at Spatial data and the tidyverse: pitfalls to avoid.
More info is at
4 Maps
R will happily plot a map if you give it some mapping polygons. However, often you want something with more of the affordances of modern interactive web maps. Fancy map tiles with streets and terrain and such are available from map providers such as google maps or stamen. But how to use them in R? Many options.
4.1 tmap
tmap (“thematic maps”) is one option (manual). It aims to be ggplot-like. It supports a leaflet backend, as does the leaflet library, below, although I think through separate codebases.
4.2 ggmap
ggmap (see quickstart) gets some of the bits and pieces from google maps via mapsapi. rgooglemaps is another alternative, I think. See Laura Ellis’s excellent tutorial, Kahle and Wickham’s tutorial.
4.3 leafletR
leafletR interfaces with leaflet.js. It is independently useful to have also because it has a GeoJSON export function, toGeoJSON which is small, light and fast via the ogre service. For complicated or big projects, it falls back to rgdal.
4.4 plotly maps
Plotly, does not specialize in maps but if your needs skew more towards the data and less towards the geography, its mapping facilities are adequate, and it has native R integration. See, for example, the R bubble maps example.
4.5 geojson output
Or, don’t generate the javascript map in R. I can also process data in R then export it as GeoJSON for use in a javascript app/website.
Here are the commands for that,
4.6 sugarbag: hip hexagon visualisation
Monash NUMBATs explain some tweaks: Hexmaps with sugarbag make it easier to see the electoral map. Here are some manual pages for that:
The examples are ggplot2-backed, which is nice for looking at but not nice for browser interaction. I wonder how the polygons can be extracted?
4.7 luscious 3d renderings
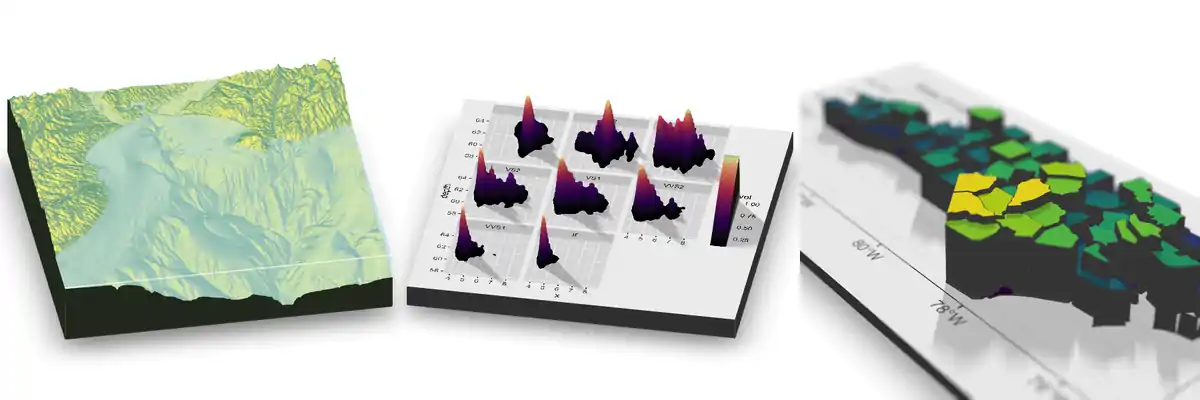
rayshader is an open source package for producing 2D and 3D data visualizations in R. rayshader uses elevation data in a base R matrix and a combination of raytracing, spherical texture mapping, overlays, and ambient occlusion to generate beautiful topographic 2D and 3D maps. In addition to maps, rayshader also allows the user to translate ggplot2 objects into beautiful 3D data visualizations.
(Thanks D.calf-e for showing me this.)
5 GDAL library dependencies
rgdal is an interface to the classic geodata infrastructure GDAL.
rgdal is notoriously fiddly to install and has many system dependencies, but it can do everything, I think. On an ubuntu system, I needed to install devtools and get the packages installed by forcing the tippy-top latest version to install:
6 Incoming
- gstat does certain R stats.
- Spatio-Temporal Statistics with R
- Andrew Zammit Mangion, WOMBAT! (for estimating CO₂ sources and sinks)
- Andrew Zammit Mangion, Multi-Scale Process Modelling and Distributed Computation for Spatial Data (Zammit-Mangion and Rougier 2019)
- FRK: Fixed Rank Kriging (Zammit-Mangion and Cressie 2021)
- LatticeKrig
- Spatstat is an R package for spatial statistics with a strong focus on analysing spatial point patterns in 2D (with some support for 3D and very basic support for space-time).