Survival analysis and reliability
Hazard rates, proportional hazard regression, life testing, mean time to failure
2019-03-12 — 2022-03-06
Wherein the Peculiarities of Right‑censoring Are Examined and the Hazard and Cumulative Hazard Functions Are Defined and Connected to Survival Probabilities for Estimating Lifetimes.

1 Estimating survival rates
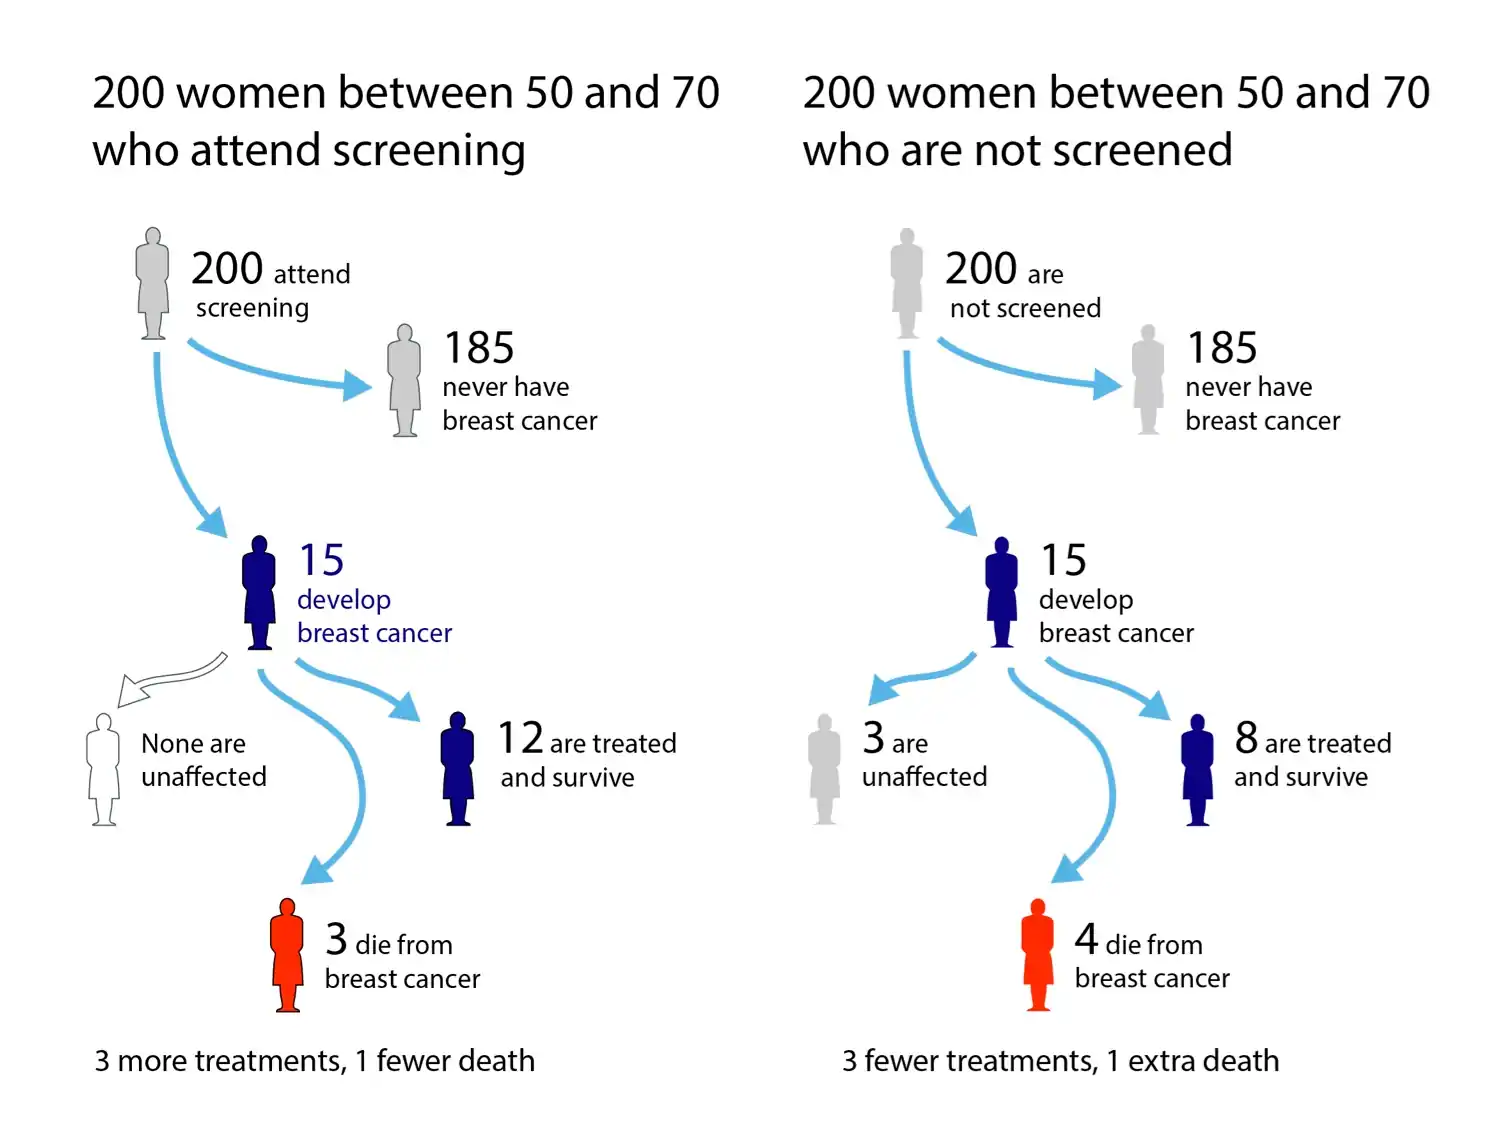
Here’s the set-up: looking at a data set of individuals’ lifespans, you would like to infer the distributions—Analysing when people die, or things break, etc. The statistical problem of estimating how long people’s lives are is complicated somewhat by the particular structure of the data — loosely, “every person dies at most one time,” and there are certain characteristic difficulties that arise, such as right-censorship. (If you are looking at data from an experiment and not all your subjects have died yet, they presumably die later, but you don’t know when.)
Handily, the tools one invents to solve this kind of problem end up being useful to solve other problems, such as point process inference, and look not so far from the densities/intensities relations.
So let’s say you have a random variable \(X\) of positive support, according to which the lifetime of your people (components, machines, whatever) is distributed, which possesses a pdf \(f_X(t)\) and cdf \(F_X(T)\).
We define several useful functions:
- The survival function (which is also the right tail CDF)
- \(S(t):=1-F(t)\)
- the hazard function
- \(\lambda(t):=f(t)/S(t)\)
- the cumulative hazard function
- \(\Lambda(t) :=\int_0^t\lambda(s) \textrm{d} s.\)
Why? Because it happens to come out nicely if we do that, and these functions acquire intuitive interpretations once we squint at them a bit. The survival function is the probability of an individual surviving to time \(t\) etc. The hazard function will turn out to be the rate of deaths at time \(t\) given that one has not yet occurred.
Using the chain rule, we can find the following useful relation:
\[S(t)=\exp[-\Lambda (t)]={\frac {f(t)}{\lambda (t)}}\]
The hazard function can be pretty much any non-negative function of non-negative support (or more generally, a Schwartz distribution, but let’s ignore that possibility for the moment.)
1.1 Life table method
Over intervals of time \([t,u]\) we define the cumulative hazard increment
\[ H(t,u) :=\int_t^u h (s) \textrm{d} s = H(u)-H(t) \]
and the survival increment
\[ \chi(t,u) :=\frac{\chi(u)}{\chi(t)} \]
The following relations are useful
\[ \chi(t)=\exp[-H (t)]={\frac {f(t)}{h (t)}}. \]
and
\[ \chi(t,u)=\frac{\exp[-H (u)]}{\exp[-H (t)]}=\exp[H (t)-H (u)]=\exp[-H (t,u)] \]
and so
\[-\log\chi(t,u)=H (t,u).\]
We estimate hazard via the life table method. Given a time interval \([t_{i}, t_{i+1})\) and survival counts \(N(t_{i})\) and \(N(t_{i+1})\) at, respectively, the beginning and end of that interval, (assuming no immigration) the life table estimate of a survival increment is
\[\hat{\chi}(t_i, t_{i+1}):= \frac{N(t_{i+1})}{N(t_{i})}\]
Plugging this in, we obtain cumulative hazard increment estimates
\[\begin{aligned} \hat{H} (t_i, t_{i+1})&=-\log \hat{\chi}(t_i, t_{i+1})\\ &=\log \frac{ N(t_{i}) }{ N(t_{i+1}) } \end{aligned}\]
From this, we construct further point estimates of \(H\) at \(t\in[0, t_1, t_2,\dots]\) as
\[\hat{H} (t)=\sum_{t_i\leq t}\hat{H}(t_{i},t_{i+1})\] By introducing assumptions on the functional form, we can estimate the entire hazard function. For example, we can take \(h (t)\) to be piecewise constant, so that
\[\begin{aligned} h (t)=\sum_i\mathbb{I}\{t_{i}<t<t_{i+1}\} h_i \end{aligned}\]
This corresponds to the assumption that \(H\) is piecewise linear and continuous; we are constructing a piecewise linear interpolant. Thus, for \(t\in(t_i,t_{i+1}],\) we such an interpolant \(\hat{H}\) for \(t\in[0,t_M]\) by a first-order polynomial spline with knots \(0,t_1,t_2,\dots, t_M\) and values \(\hat{H}(0), \hat{H}(t_1), \hat{H}(t_2) \dots,\hat{H}(t_M).\)
1.2 Nelson-Aalen estimates
a.k.a. Empirical Cumulative Hazard Function estimator.
The original Aalen paper on this is notoriously beautiful because of clever construction of a life point process and associated martingale. Clear and worth reading. Spoiler: despite the elegant derivation, the actual estimator is something a high-school student could discover by guessing.
TBC.
2 Other reliability stuff
Reliawiki has handy stuff, e.g. comprehensive docs on the Weibull law. It’s in support of some software package they are trying to sell, I think?
We can calculate an “effective age” if we want an intuitive risk measure (Brenner, Gefeller, and Greenland 1993).
3 tools
- For python sebp/scikit-survival: Survival analysis built on top of scikit-learn.
- For R Emily Zabor’s tutorial is a goofy intro to the large R survival ecosystem
4 Score function versus hazard function
- The score function and log-hazard rates are similar beasts. We can exploit that, e.g. in a Langevin dynamics algorithm? But would we gain anything useful from that?
5 Incoming
- Michael Betancourt’s survival analysis intro: Outwit, Outlast, Outmodel
Social Desirability Bias: How Psych Can Salvage Econo-Cynicism
Social desirability bias is the tendency of respondents to answer questions in a manner that will be viewed favourably by others. It can take the form of over-reporting “good behaviour” or under-reporting “bad,” or undesirable behaviour. The tendency poses a serious problem with conducting research with self-reports, especially questionnaires. This bias interferes with the interpretation of average tendencies as well as individual differences.