Survey modelling
Adjusting for the Lizardman constant
2019-08-29 — 2021-10-24
Wherein Survey Practices Are Examined and the Limits of Inference Are Delineated, With Attention to Design, Post‑stratification Adjustments and a Noted Irreducible ~4% Noise Floor in Responses

Placeholder page for information about surveys, their design, analysis and limitations.
1 When can I get any information out of surveys?
It is, in general, hard to get information out of surveys. Finding research questions that we can answer with surveys is a challenge in itself, and having done so, it is a whole specialty field to design surveys to actually get at the research question we want to answer. Typically, surveys that I have been asked to look at have not put sufficient effort into that, or they put that effort in too late.
Survey Chicken is a good essay about the difficulties:
What I mean by “surveys” is standard written (or spoken) instruments, composed mostly of language, that are administered to subjects, who give responses, and whose responses are treated as quantitative information, which may then be subjected to statistical analysis. It is not the case that knowledge can never be obtained in this manner. But the idea that there exists some survey, and some survey conditions, that might plausibly produce the knowledge claimed, tends to lead to a mental process of filling in the blanks, of giving the benefit of the doubt to surveys in the ordinary case. But, I think, the ordinary survey, in its ordinary conditions, is of no evidentiary value for any important claim.
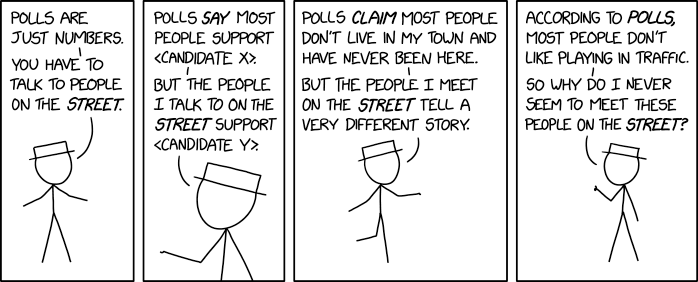
There are a lot of problems that arise. A famous one is response bias:
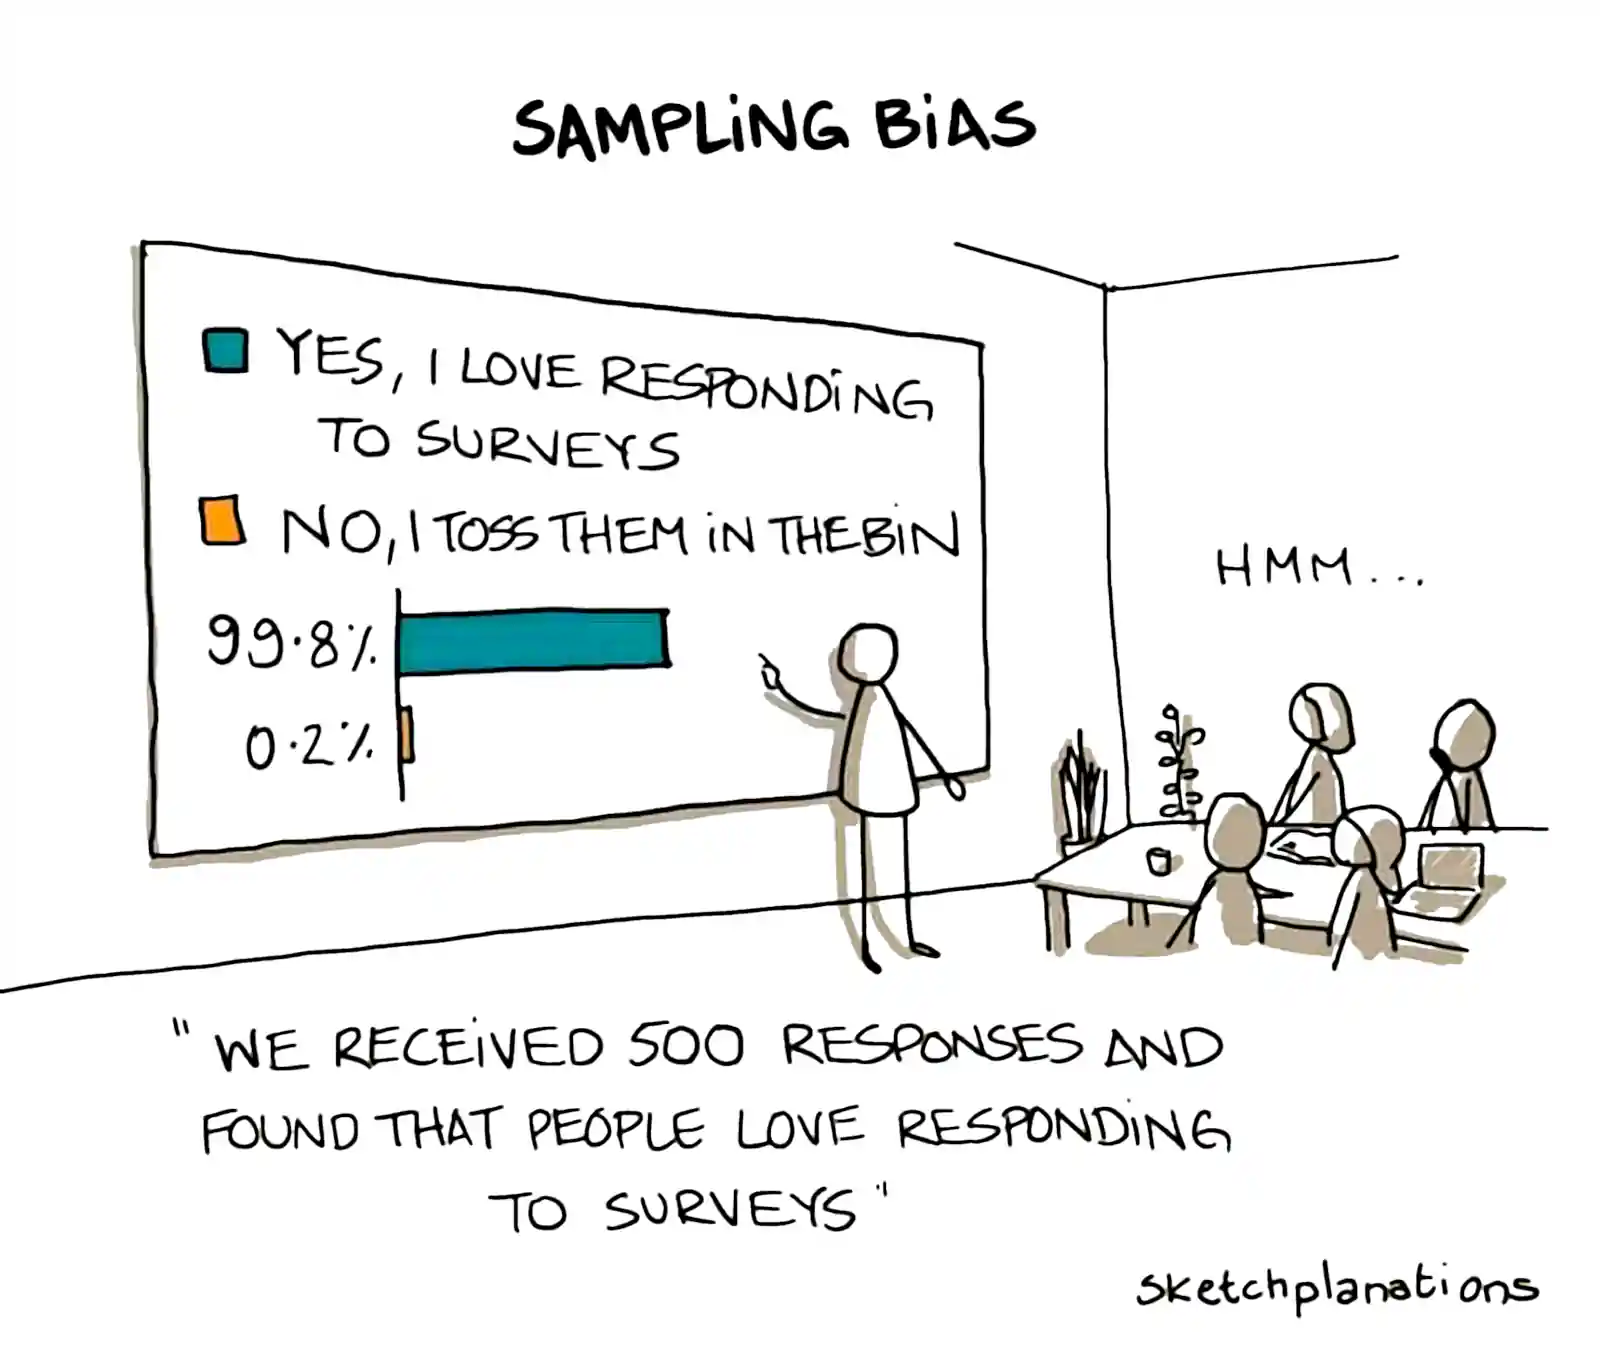
But there are so many!
Another one that I am fond of using, because it has a catchy name, is the Lizardman constant; This is the problem that survey responses have an irreducible level of noisy nonsense. Specifically, a rule of thumb 4% of people will claim their head of state is an alien Lizard monster on a survey. Related, although less lurid, nonattitudes [@].
I am particularly exercised by the problem that I refer to as the Dunning Kruger Theory of Mind, which is that, even with the best intentions in the world and an unbounded survey budget, we are not good at knowing our own minds, and even worse at knowing the minds of others. With all the focus and intent in the world, my survey responses are far more reflective of my self-image than they are of any facts about the world.
OK, many caveats, warnings and qualifications. Does that mean that surveys are useless? No, it does not. It just means that surveys are difficult and limited. But sometimes there is no other clear way to study the phenomenon of interest, so we have to do what we can. What follows are some tricks to do this.
2 Survey design
TBD. To pick a paper that I have been looking at recently, Gelman and Margalit (2021) is an example of a paper that does ingenious survey design to answer non-trivial questions.
3 Post stratification
Tricks of particular use in modelling survey data when you need to adjust for bias in who actually answers the survey. Reweighting the data to correct for various types of remediable sampling bias.
There is some interesting crossover with clinical trial theory, in that there are surprising things that you CAN learn from a biased sample in many circumstances
It is a commonly held belief that clinical trials, to provide treatment effects that are generalizable to a population, must use a sample that reflects that population’s characteristics. The confusion stems from the fact that if one were interested in estimating an average outcome for patients given treatment A, one would need a random sample from the target population. But clinical trials are not designed to estimate absolutes; they are designed to estimate differences as discussed further here. These differences, when measured on a scale for which treatment differences are allowed mathematically to be constant (e.g., difference in means, odds ratios, hazard ratios), show remarkable constancy as judged by a large number of published forest plots. What would make a treatment estimate (relative efficacy) not be transportable to another population? A requirement for non-generalizability is the existence of interactions with treatment such that the interacting factors have a distribution in the sample that is much different from the distribution in the population.
A related problem is the issue of overlap in observational studies. Researchers are taught that non-overlap makes observational treatment comparisons impossible. This is only true when the characteristic whose distributions don’t overlap between treatment groups interacts with treatment. The purpose of this article is to explore interactions in these contexts.
As a side note, if there is an interaction between treatment and a covariate, standard propensity score analysis will completely miss it.
This is a whole interesting thing in its own right; See post stratification for details.
4 Ordinal data
A particularly common data type to analyse in surveys — Ordinal models are how we usually get data from people. Think star ratings, or Likert scales.
sjplot is a handy package for exploratory plotting of Likert-type responses for social survey data. by Daniel Lüdecke.
5 Confounding and observational studies
Often survey data is further complicated by being about a natural experiment where we must deal with non-controlled trials. See Causal graphical models.
6 Graph sampling
Cannot pull people from the population at random? How about asking people you know and getting them to ask people they know? What can we learn from this approach? See inference on social graphs.
7 Data sets
SDA is a suite of software developed at Berkeley for the web-based analysis of survey data. The Berkeley SDA archive lets you run various kinds of analyses on a number of public datasets, such as the General Social Survey. It also provides consistently-formatted HTML versions of the codebooks for the surveys it hosts. This is very convenient! For the gssr package, I wanted to include material from the codebooks as tibbles or data frames that would be accessible inside an R session. Processing the official codebook from its native PDF state into a data frame is, though technically possible, a rather off-putting prospect. But SDA has done most of the work already by making the pages available in HTML. I scraped the codebook pages from them instead. This post contains the code I used to do that.
8 To elicit wisdom of crowds
See Wisdom of crowds.
9 Incoming
- Mastroianni on The Art of Asking Questions
- Pew Research Center, Writing Survey Questions
- Item response theory