Australia in data
2020-01-24 — 2025-11-18
Wherein Australia’s Data Is Surveyed, National Geodata Collections Are Noted, and the AIATSIS Map of Indigenous Australia Is Presented as the Conventional Source for Traditional‑owner Boundaries.
Data about Australia. Australia’s attempts to quantify itself vary in quality and usefulness. See Rob J. Hyndman’s piece We need more open data in Australia.
1 Cultural
There are some great cultural data sets in Australia, but I hear about them more for their fragility and controversy than for their content.
2 Geodata
There is in fact a vast amount of high quality open data about Australia, and I have completely lost track of this category. This section is woefully incomplete.
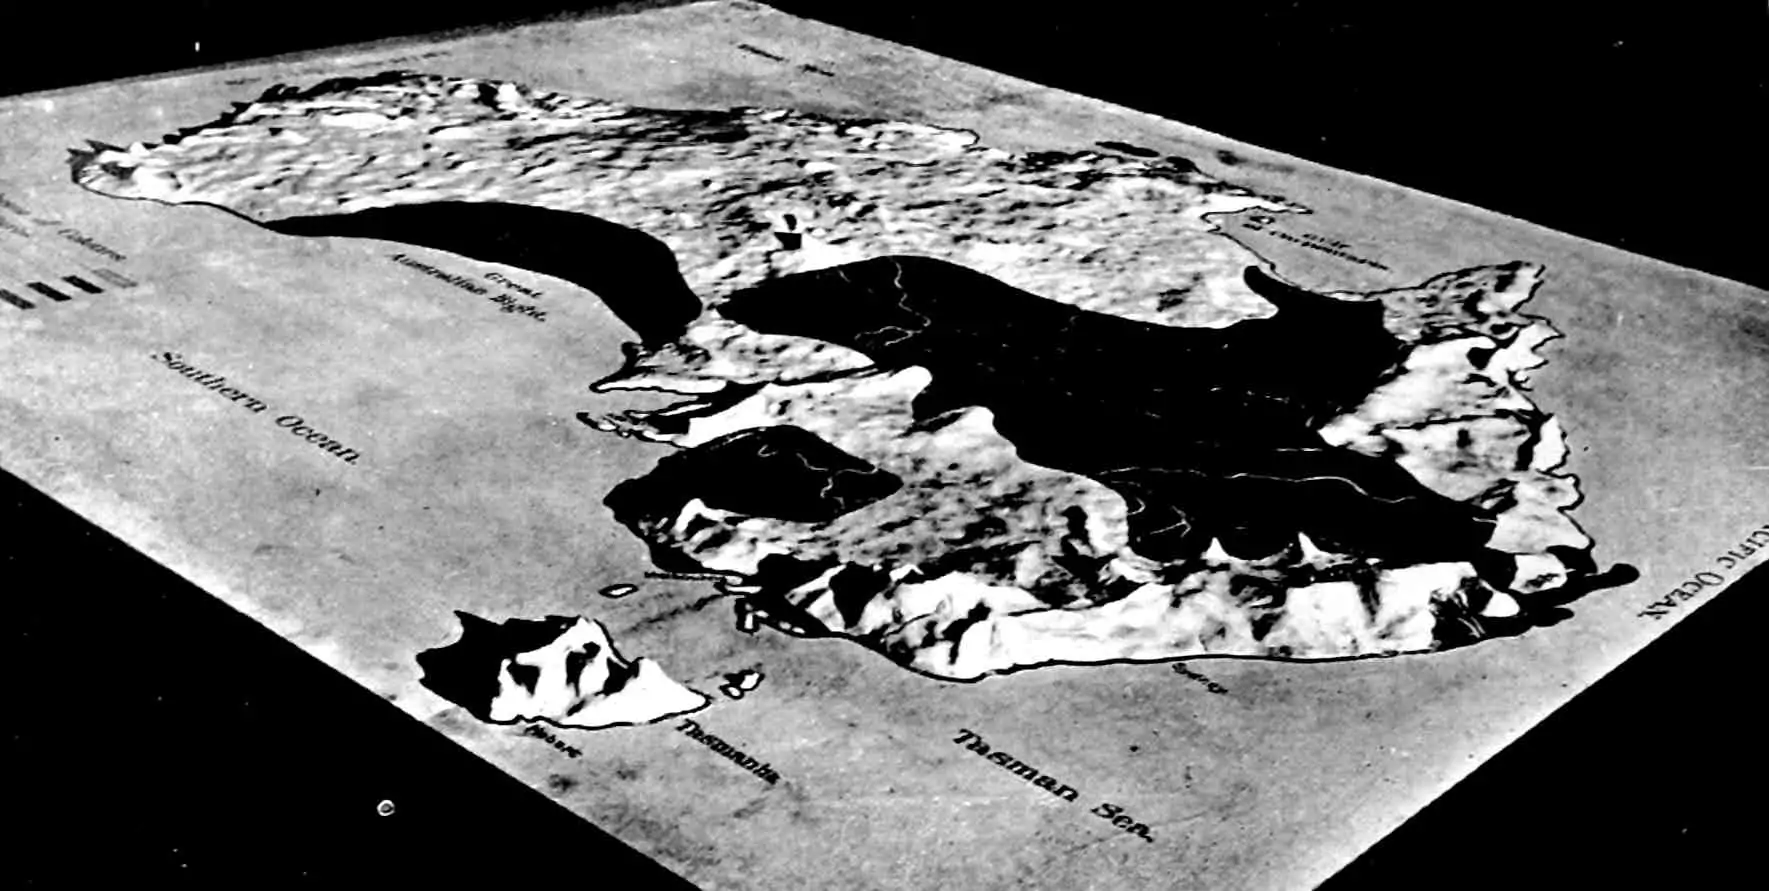
Why not start with the oldest human geodata?
The AIATSIS Map of Indigenous Australia is a good place to start. It shows the conventionally agreed boundaries between the traditional owners of the land we’re on and indicates who we should pay our respects to.
Digital Earth Australia aggregates several useful datasets.
- Digital Earth Australia Map
- Digital Earth Australia Hotspots (mostly things on fire)
Open Data Cube is a Python library for working with satellite images that originated in Australia:
The Open Data Cube (ODC) is a non-profit, open-source project motivated by the need to better manage Satellite Data. This project was born out of the work done under the “Unlocking the Landsat Archive” and the Australian Geoscience Data Cube (AGDC) projects.
TERN maps ecosystem data:
2.1 Real estate
Australians’ obsession with real estate makes microburbs a handy spatial dataset; it’s a loss leader for a real-estate-oriented data consultancy.
The microburbs dataset claims to include
70,000 data points for every Microburb (55,000 of these, with an average of 400 residents), far more than publicly available on the site.
10-300 data points on every address in Australia. It covers features to a fine-grained level:
- Demographics
- Geography
- Amenities and businesses
- Infrastructure
- Voting patterns
- Livability scores
This is ideal for:
- Identifying real estate buying opportunities
- Assessing the performance of real estate agents
- Retail store placement and location analysis
- Planning and development concerns
Their pitch explains the situation. I’d read it as: “We have not updated our data substantially since 2016, and our free services are increasingly stale.” I reckon if we need current info, they’ll cut us a deal.
2.2 Nature
2.3 Climate change
As noted under climate change, we can download projections data.
2.4 Industry
There’s a neat report Creative designs: geography of Australia’s digital technology industries (Hajkowicz et al. 2023) that plots where “tech happens” in Australia. Download here. Interactive map here.
3 Population data
3.1 Australian Bureau of Statistics
Traditionally, ABS data has been “open” but a total PITA to use automatically, because it arrives in idiosyncratic spreadsheets with an obscure filing system.
The data’s idiosyncrasies may be fixed by the new Data API; it’s an SDMX-REST:2.1-compliant repository that works with standard official statistics tools.
The more traditional spreadsheet-download method is still available, and there are some packages to help with that. Rob Hyndman points out the following:
3.2 Australian electoral data
eechidna, by Jeremy Forbes, Carson Sievert, Rob Hyndman, Diane Cook, Heike Hofmann, and many others, has spatiotemporal electorate data from 2001–2019. It’s an excellent package and the one I use myself. Recommended.
For a simple example, check out Where your vote counts (source code), which maps how marginal federal electorate votes in Australia have been, and therefore where we probably have the most power as voters.
Monash NUMBATs explain some tweaks: Hexmaps with sugar bag make it easier to see the electoral map.
Peter Ellis, on his Australian Federal Election 2019 forecasts post, introduces his useful ozfedelect package for R for modelling with electoral data. There’s more stuff from that author.
We can also DIY. Ben Raue advises:
The election results data published by the AEC is already pretty good. It’s tidy and easily interconnectable with unique IDs. Unlike the state and local election results which is why I started my own collection of those results in a tidy format. All the results websites are available from the AEC website then click through to downloads. In some cases datasets are broken up by geography (by state or electorate) but it’s trivial to merge them back together in R. The House of Reps downloads for 2019 are here.
4 Legal setting
Open data has had a moment (Bureau of Communications Research and Deloitte Access Economics 2016; J. Houghton and Gruen 2012; J. W. Houghton and Gruen 2014). In a previous job I actually helped the state of NSW open its data. That’s a story for another time — I have too much to say about it to fit here, so I’ll say nothing at all.
5 Other fun stuff
- Life tables.
- OZdatasets is a large index of Australian datasets found by rOpenSci OzUnconf19 volunteers.
- OpenNEM: NEM tracks energy-market stats, generation and supply.